Key Takeaways
- Quality failures can create high hidden costs, with top medical-device manufacturers spending about one-fifth and top pharmaceutical manufacturers about one-fourteenth of the median producer on waste and rework.
- First-pass yield varies by manufacturing environment, with automotive and aerospace often exceeding 95%, while high-mix and job-shop operations commonly run at 85%–90%.
- NetSuite Quality Management can improve FPY through standardized testing, receiving and in-process inspections, automated holds and rework, and defect analysis.
First-pass yield can vary significantly across manufacturing environments. A 2025 benchmark for job-shop manufacturers puts median first-pass yield at 94%, while top-quartile operations reach 98%, showing how much room there can be to reduce defects and rework even in established production environments.
First-pass yield (FPY) measures the percentage of units that meet quality requirements the first time they move through production, without rework, repair, or additional processing. For manufacturers, improving FPY can reduce wasted materials and labor while helping production teams identify where defects are entering the process.
NetSuite Quality Management supports this by standardizing inspections, capturing quality results, tracking nonconformances, and connecting quality data with production processes.
What Is First-Pass Yield and Why Does It Matter?
FPY measures how often a product moves through a production process correctly the first time, without requiring rework, repair, or additional processing. When a unit fails an inspection and has to return to a previous operation, the manufacturer has to spend additional labor, machine time, materials, and production capacity to bring that unit up to specification.
For example, a defective assembly may need to be disassembled and rebuilt, a product with the wrong component may need to be corrected, or a unit that fails testing may have to go back through production before it can ship. Each of these cases consumes resources that have already been used once, effectively requiring the production team to perform part of the work again.
This makes FPY more than a quality metric. It shows how efficiently production capacity is being converted into finished, acceptable products. A lower FPY means more of the manufacturer’s available capacity is being absorbed by rework, repair, and scrap instead of producing sellable output.
The First-Pass Yield Formula
The formula to calculate first-pass yield is the number of non-defective units produced correctly the first time, divided by the total number of units started, expressed as a percentage.
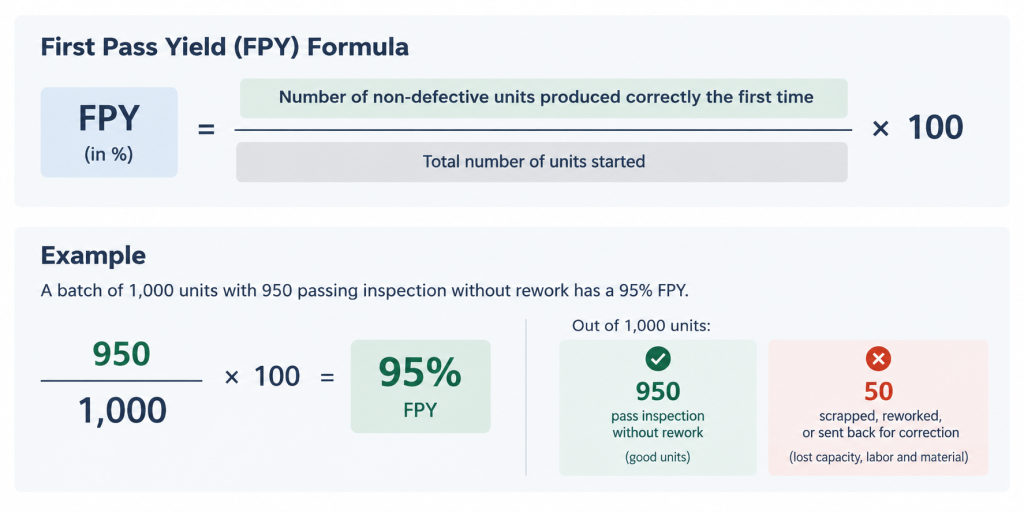
A batch of 1,000 units with 950 passing inspection without rework has a 95% FPY. The other 50 units, whether scrapped, reworked, or sent back for correction, represent capacity, labor, and material that already went into building something the company can’t sell as-is.
What Good FPY Looks Like
There’s no single target number, because the realistic benchmark depends heavily on process complexity. Automotive and aerospace manufacturers, running mature, tightly controlled processes, typically exceed 95% FPY.
Job shops and high-mix, low-volume operations, where product changeovers happen constantly, often run 85% to 90%, and that’s considered normal for the complexity involved. A company chasing a 99% target on a high-mix floor is usually solving the wrong problem.
The Real Cost of Low FPY
Every unit that fails first-pass inspection costs more than the direct rework labor. It also consumes the capacity that could have gone to the next order, delays shipment dates, and in regulated industries, generates documentation that has to be reviewed and justified during an audit.
What Causes Low First Pass Yield on the Floor?
A low FPY number is a symptom. The actual causes cluster around a small number of upstream gaps that repeat across most manufacturing operations.
Inconsistent Inspection Criteria Across Shifts
When inspection standards live in an inspector’s head or a printed checklist that varies by who’s holding it, the same defect gets caught by one shift and missed by another. FPY numbers that swing without any change in the production process are usually a sign of this.
No Early Detection Before a Defect Compounds
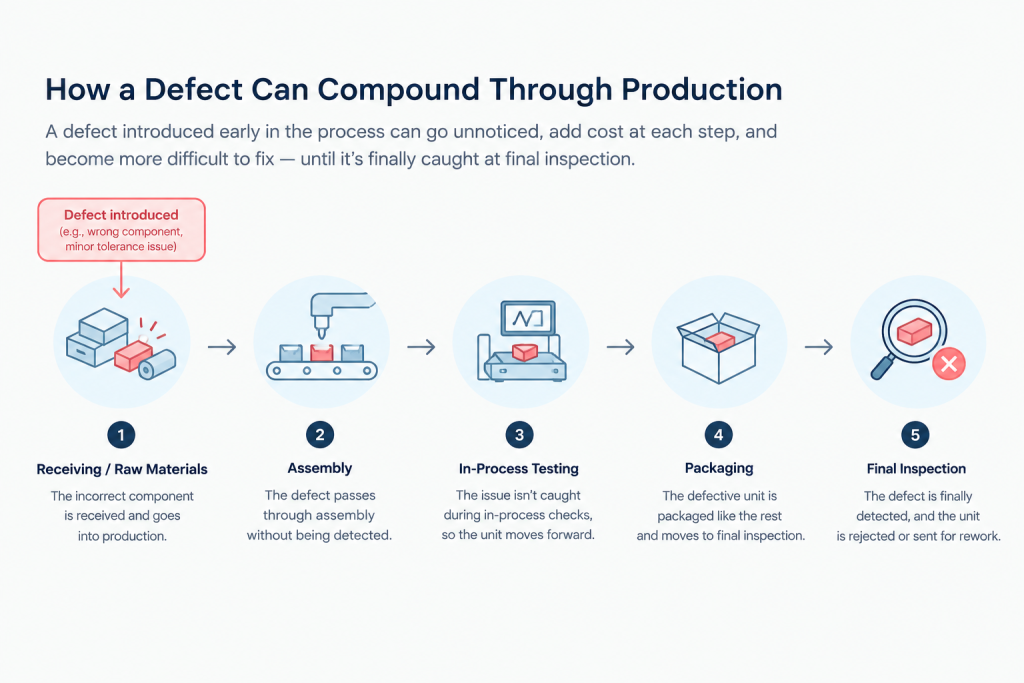
A defect caught at final inspection costs far more to fix than the same defect caught at the process step where it was introduced. Because by final inspection, it’s often buried under several more steps of value already added on top of it. Operations that only inspect at the end are always going to show a worse FPY than the process quality alone would suggest.
Supplier Material Variability Nobody Catches at Receiving
A raw material or component that’s slightly out of spec doesn’t always fail obviously. It shows up several steps downstream as an intermittent defect that looks like a process problem until someone traces it back to a specific incoming lot.
Quality Data Trapped in Paper or Spreadsheets
Inspection results recorded on paper or in a disconnected spreadsheet can’t be analyzed for patterns in real time. A supplier whose components fail inspection twice as often as any other supplier is invisible until someone manually compiles months of paper records to find it.
How Does NetSuite Quality Management Improve First-Pass Yield?
Each cause above has a direct counterpart inside NetSuite’s Quality Management module. Here’s what each mechanism does.
Standardized Test Definitions
Test definitions set acceptable ranges, required measurements, and inspector requirements once and enforce them consistently across products, suppliers, and locations. This directly removes the shift-to-shift inconsistency that makes FPY numbers fluctuate without any real change in production quality.
Staged Inspections at Receiving, In-Process, and Final
Rather than relying on a single inspection at the end, NetSuite QMS supports inspections triggered automatically at goods receipt, at defined in-process steps, and at final output.
Catching a defect at the process step where it was introduced, instead of three steps later, is the single biggest lever for improving FPY without changing anything about the production process itself.
Automated Hold and Rework Routing
When an item fails a test, inspection rules configured by item, vendor, or location automatically route it for hold, rework, or return to the supplier. This gives the team a defined next step for failed items and records how each item was handled, making it easier to track quality issues and follow up on recurring defects.
Mobile Data Collection on the Floor
Inspectors record results directly from a mobile device at the point of inspection instead of on paper that gets transcribed later, if it gets transcribed at all. This is also what makes real-time defect analytics possible in the first place, since the data exists in the system the moment it’s captured.
Real-Time Defect and Supplier Analytics
Dashboards tracking defect rates, inspection trends, and supplier quality performance turn scattered inspection results into a pattern that’s visible immediately.
Quality data doesn’t live in isolation from the rest of production either. Supplier quality performance tracked here feeds directly into the sourcing rules NetSuite MRP uses to plan purchases, and in-process inspections tie to the same routing steps that govern work-in-process tracking. None of this works as a standalone module. It works because it’s connected to the systems already running the floor.
What Does This Look Like in a Real Manufacturing Operation?
Skydio, a US drone manufacturer, ran on fragmented systems before its NetSuite implementation, including no unified quality management for the vehicle testing every unit went through.
Folio3’s implementation connected NetSuite’s Quality Management module directly to Skydio’s vehicle testing system. This gave the American drone manufacturing company valued at $4.4 billion one system where test results and inspection outcomes are tied to specific units and assemblies instead of living in a separate testing platform disconnected from production. The full Skydio case study covers the broader implementation.
Neither company set out to chase an FPY number specifically. Both ended up with the underlying visibility that makes improving it possible.
How Do You Move the FPY Number With NetSuite QMS?
Turning on inspections everywhere at once usually produces a flood of data nobody has time to act on, not an improved yield number. A more deliberate rollout gets results faster.
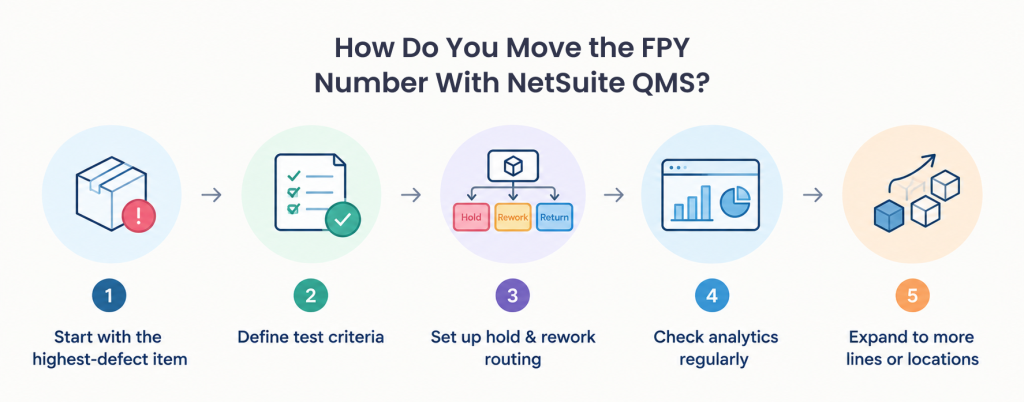
- Start with the highest-defect item or product line rather than the full catalog, since that’s where the FPY improvement will be most visible and easiest to justify to the rest of the business.
- Define test criteria before turning on automatic inspection triggers, because an inspection without a clear pass or fail standard just generates ambiguous data.
- Tie hold and rework routing to an actual disposition process that someone owns, so failed items don’t sit in limbo waiting for a decision.
- Review defect and supplier analytics on a fixed cadence, weekly for high-volume lines, since a dashboard nobody looks at prevents nothing.
- Expand to additional items or locations only once the first rollout shows a measurable FPY change, so the pattern that worked gets repeated instead of guessed at again from scratch.
Where FPY Improvement Efforts Go Wrong
Improving first pass yield requires the right target, timely inspection, manageable data, and a feedback loop into purchasing and production. Common gaps in any of these areas make quality efforts harder to sustain without addressing the causes of low FPY.
Chasing a Universal FPY Target
Applying a 99% target to a high-mix, low-volume line ignores that realistic FPY benchmarks for this type of operation may be closer to 85%–90%. Setting targets around the production environment helps teams focus on meaningful process improvements rather than chasing an unrealistic number.
Inspecting Only at Final Output
Final inspection identifies defects after materials, labor, and machine capacity have already been consumed. In-process inspections catch problems earlier and allow teams to correct the process before the same defect affects additional units.
Turning On Every Inspection Rule at Once
Collecting inspection data across every item and location from day one can overwhelm the people responsible for reviewing and acting on it. A phased rollout focused on critical items and high-risk processes is easier to manage and gives teams time to establish clear ownership.
Not Connecting Inspection Data to Supplier Sourcing
Defect data becomes more useful when it informs supplier performance reviews and sourcing decisions. If recurring material issues are recorded but never influence supplier selection or sourcing rules, the same quality problems continue through future shipments.
Improving First-Pass Yield With NetSuite
First-pass yield gives manufacturers a practical measure of how often production gets it right the first time. When FPY falls, the causes range from inconsistent inspections and supplier quality issues to production errors and defects detected too late. Identifying those patterns is the first step toward reducing rework, scrap, and wasted capacity.
NetSuite Quality Management helps manufacturers standardize inspections, capture quality results, track nonconformances, and connect quality data with production and supplier processes.
Are you looking to improve FPY in your NetSuite environment? Connect with Hani Mamdani, ERP Consulting Manager at Folio3, to discuss your quality management and NetSuite requirements.
FAQs
What is a good first-pass yield percentage?
It depends heavily on process complexity. Automotive and aerospace manufacturers typically exceed 95%. Job shops and high-mix, low-volume operations commonly run 85% to 90%, which is a realistic benchmark for that level of complexity rather than a sign of a quality problem.
How is first-pass yield different from overall yield or first time yield?
First-pass yield counts only units that passed without any rework. A unit that failed and was successfully reworked still counts against FPY even though it eventually shipped. First time yield is calculated similarly but is sometimes applied at a single process step rather than across the full production run.
Does NetSuite have a built-in first-pass yield report?
NetSuite Quality Management provides defect rate and inspection trend dashboards that supply the underlying data FPY is calculated from. Most manufacturers configure a specific FPY calculation using that inspection data rather than relying on a single pre-built report, since the formula depends on how a company defines a “pass.”
What’s the fastest way to improve first-pass yield with NetSuite?
Moving inspection earlier in the process, catching a defect at the step where it’s introduced instead of at final output, and standardizing test definitions so results are consistent across shifts and inspectors are the two changes that show up fastest in the FPY number.
Do small manufacturers need formal quality management software, or is a checklist enough?
A paper checklist works until inspection volume or supplier count grows past what one person can track by memory. At that point, inconsistent criteria and untracked supplier patterns start showing up as FPY swings that a checklist can’t explain or fix.