
Key Takeaways
- NetSuite’s Vendor Management tracks items and pricing, lead times, on-time deliveries, defects, and shortages from every recorded transaction against that vendor.
- Five core metrics cover most supplier-performance risks. These metrics are OTIF, defect rate, lead-time accuracy, purchase price variance, and responsiveness.
- Defect tracking requires Quality Management inspection and non-conformance processes.
- Vendor-level averages hide item-level problems, so scorecards should support supplier- and item-level analysis.
- NetSuite provides native vendor-delivery tracking, with custom KPIs and saved searches available for additional metrics.
A vendor performance scorecard gives manufacturers a consistent way to measure whether suppliers are meeting expectations for delivery, quality, lead time, cost, and responsiveness.
NetSuite already provides native vendor delivery-performance capabilities and a Vendor Delivery Performance KPI Scorecard on the Procurement Dashboard. It shows purchase-order volume, late or unreceived orders, and on-time delivery performance. NetSuite also calculates predicted days early or late and predicted risk confidence using historical vendor order and receipt data.
But for manufacturers, delivery performance is only one part of the picture. A supplier can deliver on time and still create production problems through defective material, inconsistent lead times, price variance, or slow corrective-action responses.
The most useful scorecard combines the metrics NetSuite provides natively with additional KPIs built from purchasing, receiving, quality, and financial data.
What Does a Manufacturing Vendor Scorecard Measure?
A manufacturing vendor scorecard measures supplier performance against the areas that affect production, inventory, cost, and customer commitments.
The exact metrics should depend on the manufacturer’s supply chain. A contract manufacturer purchasing standard components may emphasize delivery and price. A medical device manufacturer may place much greater weight on inspection failures, lot traceability, and corrective actions. A high-mix manufacturer with long-lead materials may need to focus heavily on lead-time variability and shortages.
A useful scorecard should answer five questions:
- Did the supplier deliver what we ordered when we needed it?
- Did the material meet our quality requirements?
- How predictable is the supplier’s lead time?
- Did the actual purchase cost match what we expected?
- How quickly does the supplier respond when something goes wrong?
The scorecard becomes much more useful when these measurements are traced back to individual purchase orders, receipts, items, lots, inspections, and corrective actions.
What Vendor Performance Data Does NetSuite Provide?
NetSuite provides several native capabilities that manufacturers can use as the foundation for supplier performance tracking.
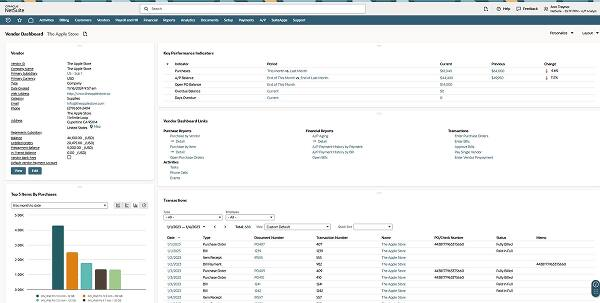
Its Vendor Delivery Performance feature analyzes vendor orders and receipts over a configured historical period. The system calculates average days early or late, standard deviation, number of orders included in the analysis, predicted days early or late, and predicted risk confidence.
The default vendor performance order analysis interval is six months, although the configuration can be changed.
Vendor Delivery Performance KPI Scorecard
NetSuite also provides a Vendor Delivery Performance KPI Scorecard through the Procurement Dashboard. The native scorecard compares vendor delivery performance:
- Total purchase orders
- Late or unreceived orders by vendor
- On-time delivery performance
The default late-delivery logic uses a 14-day threshold after the expected receipt date. If an expected receipt date is unavailable, NetSuite uses the due date or transaction date. That threshold can be customized in the underlying saved search.
This distinction matters for manufacturing organizations.
A 14-day delay may be acceptable for a low-priority office supply, but it could be operationally significant for a component needed to complete a production order tomorrow. This is why manufacturers should review the default calculation against their material lead times and production requirements.
NetSuite also lets organizations extend the Procurement Dashboard with custom KPIs based on saved searches.
That gives manufacturers a practical structure:
Native NetSuite delivery metrics → custom purchasing KPIs → quality metrics → operational response
Which Vendor Performance Metrics Should Manufacturers Track?
There is no single set of metrics that fits every supplier. A manufacturer should start with the metrics that correspond to its biggest supply-chain risks.
| Metric | What it tells you | Particularly useful for |
|---|---|---|
| OTIF | Whether material arrived in the required quantity and within the required window | Production-critical suppliers |
| On-time delivery | Whether receipts meet the defined delivery date | Most manufacturers |
| Defect rate / PPM | How often received material fails quality requirements | Regulated and quality-sensitive manufacturing |
| Lead-time variance | How predictable supplier lead times are | Long-lead and imported materials |
| Purchase price variance | Whether actual purchasing cost differs from the expected cost | Cost-sensitive manufacturers |
| Supplier responsiveness | How quickly the supplier responds to issues and corrective actions | Strategic and high-risk suppliers |
| NCR/CAPA trends | Whether supplier quality problems are recurring and being resolved | Quality-driven and regulated manufacturers |
The five core areas worth building around are delivery, quality, lead-time reliability, cost, and responsiveness.
1. OTIF
On-time in-full, or OTIF, measures whether a supplier delivered the required quantity within the agreed delivery window.
A simple OTIF calculation is:
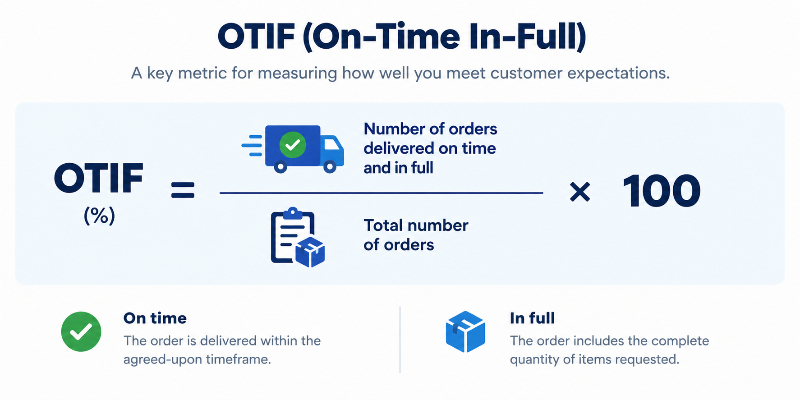
For example, if a manufacturer receives 100 eligible supplier order lines during a period and 91 arrive within the agreed date and quantity requirements, the OTIF rate is 91%.
The important part is defining “on time” and “in full” before calculating the metric.
Define What On Time Means Before Measuring It
Manufacturers should establish a consistent rule for:
- Original requested date vs. supplier-confirmed date
- Early deliveries
- Partial shipments
- Split receipts
- Backorders
- Cancelled lines
- Buyer-requested date changes
- Supplier-requested date changes
- Quality holds after receipt
Consider a purchase order for 1,000 components due on June 10.
The supplier sends 400 units on June 8 and the remaining 600 on June 17. Depending on the manufacturer’s rule, the order may be treated as late because the complete quantity was not available by June 10, even though the first shipment arrived early.
That difference matters in manufacturing organizations because receiving some material does not necessarily mean production has the material it needs.
A supplier that consistently sends partial shipments may appear acceptable when measured only by the first receipt date while still creating shortages on the shop floor.
2. Supplier Quality
Delivery performance tells you when material arrived. Quality performance tells you whether the material was usable.
For manufacturers, supplier quality can include:
- Defect rate
- Defects per million opportunities or parts
- Inspection failure rate
- Rejected lots
- Supplier returns
- Non-conformance records
- Rework caused by incoming material
- Scrap caused by supplier defects
- Recurring defect types
- Open corrective actions
- Overdue corrective actions
The calculation should account for production volume.
For example:
Defect rate = Defective units ÷ Units inspected × 100
A supplier with 20 defective units out of 10,000 received units has a 0.2% defect rate. A supplier with 20 defective units out of 200 units has a 10% defect rate.
The raw number of defects is identical, but the operational meaning is very different.
How NetSuite Quality Management Supports Supplier Quality Tracking
If the manufacturer uses NetSuite Quality Management, supplier quality data can be connected to inspection and non-conformance processes.
NetSuite Quality Management supports inspection queues and quality specifications for defining how inventory and processes are evaluated. Its quality functionality also records failed inspections and supports non-conformance workflows.
The Non-Conformance Register tracks issues through review, root-cause analysis, corrective and preventive action, and verification and closure.
This creates a much stronger supplier-quality picture than simply counting vendor returns.
Instead of asking:
“How many parts did we return to this supplier?”
the manufacturer can ask:
“Which supplier, item, lot, and defect type is generating recurring incoming-quality failures, and are the resulting corrective actions being closed?”
That is the level of detail a manufacturing scorecard should aim for.
3. Item-level Supplier Quality
A supplier-level quality average can hide a serious problem.
Suppose Supplier A provides 50 different components. Forty-nine perform consistently, while one critical machined component has repeated dimensional failures.
If the manufacturer calculates one overall supplier quality score, the supplier may still appear acceptable.
The better analysis is:
Supplier → Item → Receipt/Lot → Inspection → Defect → NCR → Corrective Action
This lets procurement and quality teams determine whether the problem is:
- Supplier-wide
- Specific to one component
- Specific to one production location
- Limited to a particular lot
- Associated with a recurring defect type
- Related to a particular manufacturing process
This is especially important for manufacturers purchasing hundreds or thousands of SKUs from the same supplier.
4. Lead-Time Reliability Shows How Predictable a Supplier Really Is
Average lead time is useful, but average lead time alone hides variability. For example, take two suppliers, both of which have an average lead time of 20 days.
Supplier A delivers in 19–21 days almost every time.
Supplier B delivers anywhere from 10 to 35 days.
Their averages are similar, but their planning risk is very different.
For this reason, manufacturers should consider tracking:
- Average actual lead time
- Average days early or late
- Lead-time variance
- Standard deviation
- Maximum days late
- Percentage of orders exceeding expected lead time
- Number of orders used in the calculation
NetSuite’s Vendor Delivery Performance functionality already calculates average days early/late and standard deviation, alongside predicted days early/late and predicted risk confidence.
That makes the native functionality particularly useful for understanding predictability rather than simply looking at whether a supplier was technically late.
A supplier whose deliveries are consistently two days late may be easier for planning teams to accommodate than one whose deliveries alternate between five days early and three weeks late.
5. Purchase Price Variance
Supplier performance also affects manufacturing margins.
Purchase Price Variance (PPV) measures the difference between the expected or standard purchase cost and the actual purchase cost.
A simplified calculation is:
PPV = Actual purchase cost − Expected purchase cost
For example, if a component is expected to cost $12 per unit and the supplier invoices it at $13.25, the variance is $1.25 per unit.
Across 20,000 units, that becomes a $25,000 purchasing variance.
The important point is to investigate the reason behind the variance.
Possible causes include:
- Supplier price increases
- Contract pricing changes
- Expired quotes
- Incorrect purchase-order pricing
- Quantity breaks
- Currency fluctuations
- Freight or landed-cost changes
- Buyer or supplier data-entry errors
This is why a vendor scorecard should show the variance alongside the transaction details that produced it.
A supplier whose price increases are documented and approved is a different situation from one whose invoices repeatedly exceed PO pricing without explanation.
6. Supplier Responsiveness
Some supplier problems cannot be prevented entirely. The supplier’s response determines how quickly the issue is contained.
Manufacturers should track measures such as:
- Time to acknowledge a quality issue
- Time to provide a replacement commitment
- Time to respond to a shortage
- Time to submit root-cause information
- Corrective-action closure time
- Number of overdue supplier actions
- Number of recurring issues after corrective action
This metric usually requires more process definition than simply measuring delivery dates.
For example, if a supplier receives an NCR on July 1, the manufacturer can measure:
Days to response = Supplier response date − NCR date
For recurring quality issues, the more important measure may be whether the supplier resolved the underlying cause.
NetSuite Quality Management’s NCR and CAPA processes can assign owners, due dates, priorities, and statuses to corrective and preventive actions, providing a foundation for tracking closure.
Why a Single Vendor Average Can Hide the Problem
A single supplier score can be useful for quickly identifying vendors that need attention. It should not replace transaction-level analysis.
Consider a supplier with these results:
| Metric | Supplier Average |
|---|---|
| On-time delivery | 94% |
| Defect rate | 0.8% |
| Price variance | 1.2% |
At first glance, this supplier appears stable.
Now break the data down by item:
| Item | On-Time Delivery | Defect Rate |
|---|---|---|
| Component A | 99% | 0.1% |
| Component B | 98% | 0.2% |
| Component C | 81% | 4.7% |
The supplier-level score hides the problem.
Component C may be a production-critical item, making its 4.7% defect rate much more consequential than the overall 0.8% supplier average suggests.
This is why manufacturing scorecards should support drill-down by:
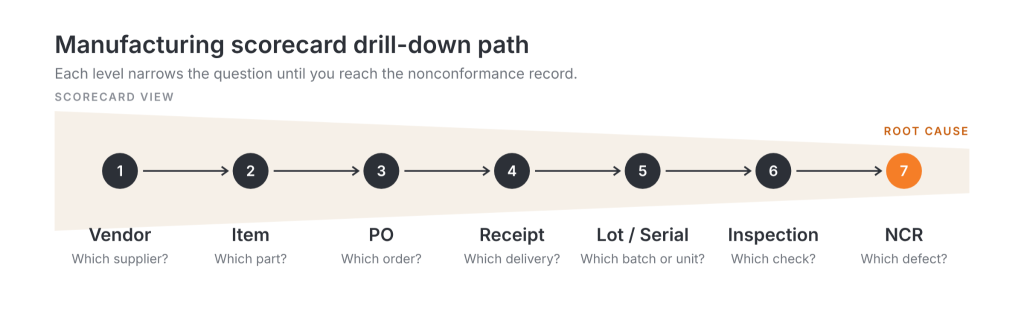
The vendor score identifies where to look. The transaction history explains why the score changed.
How to Build a Vendor Performance Scorecard in NetSuite
The most effective approach is to start with the data already being captured in NetSuite and then add custom KPIs where the native scorecard does not cover the manufacturer’s requirements.
Step 1: Define the measurement rules
Before creating saved searches or KPIs, decide:
- What counts as on time?
- Are partial receipts considered on time?
- Which date is authoritative?
- How are supplier-approved date changes treated?
- How are cancelled POs handled?
- How are quality failures counted?
- What qualifies as a defect?
- How is PPV calculated?
- What period should be analyzed?
This prevents the scorecard from becoming a moving target.
Step 2: Map the required NetSuite records
The scorecard may draw information from:
- Purchase orders
- Item receipts
- Vendor records
- Vendor bills
- Items
- Locations
- Quality inspection records
- NCRs
- CAPA records
- Saved searches
The exact data model depends on the features and processes enabled in the account.
Step 3: Start with critical suppliers and items
Do not attempt to score every supplier with the same level of detail on day one.
Start with suppliers that affect:
- Production-critical components
- Long-lead materials
- High-value purchases
- Regulated products
- Customer-critical products
- High-volume materials
- Materials with recurring quality issues
This produces a scorecard that procurement and operations can use.
Step 4: Use the native Vendor Delivery Performance scorecard as the starting point
NetSuite’s Procurement Dashboard already includes a Vendor Delivery Performance KPI Scorecard showing total purchase orders, late or unreceived orders, and on-time delivery performance.
Manufacturers can then extend the dashboard with custom KPIs based on saved searches where additional measurements are required. NetSuite supports adding custom KPI searches to the Procurement Dashboard.
Step 5: Build exception-focused views
The dashboard should make exceptions easy to find.
For example:
Supplier performance drops → Identify supplier → Identify affected item → Open POs/receipts → Review inspection/NCR history → Identify cause → Assign corrective action → Monitor next receipts
The objective is to shorten the distance between a metric changing and someone understanding why.
Be Careful With NetSuite’s Default Late-Delivery Threshold
One of the most important configuration details is the default 14-day late-delivery threshold used by the Procurement Dashboard’s Vendor Delivery Performance saved search.
The threshold can be changed by modifying the saved-search formula.
Manufacturers should review this against their actual production environment.
For example:
- A supplier delivering packaging material three days late may have little production impact.
- A supplier delivering a production-critical component three days late could stop a work order.
- A supplier delivering a six-week lead-time component 14 days late may create a much larger planning problem.
The scorecard’s definition of “late” should therefore reflect the manufacturer’s operational reality.
What Should Happen When a Vendor’s Scorecard Slips?
A scorecard is useful only when a change in performance leads to an action. A practical response process is:
1. Confirm the metric
Determine whether the decline is actual or caused by incomplete or incorrectly classified data.
2. Identify the affected item
Check whether the problem is supplier-wide or limited to a particular SKU, location, lot, or product family.
3. Review the underlying transactions
Open the relevant purchase orders, expected receipt dates, receipts, vendor bills, inspection results, and returns.
4. Identify the cause
Possible causes include:
- Supplier capacity constraints
- Forecast changes
- Transportation delays
- Incorrect lead times
- Quality failures
- Purchase-order errors
- Pricing changes
- Internal receiving delays
5. Assign corrective action
For quality-related issues, this may involve an NCR and CAPA process. For delivery issues, procurement may need a supplier commitment, revised lead time, or sourcing change.
6. Monitor the next cycle
A corrective action should change future performance. If the same problem continues, the manufacturer has evidence that the issue is recurring.
NetSuite also provides a Vendor Performance History approach using saved searches and system notes to identify negative performance trends, including declining delivery performance.
How Often Should Manufacturers Review Vendor Performance?
The review frequency should match the supplier’s operational risk.
Weekly:
Review production-critical suppliers, open shortages, late orders, quality failures, and urgent corrective actions.
Monthly:
Review the broader vendor scorecard, including delivery, quality, lead time, cost, and responsiveness trends.
Quarterly:
Use the longer-term trend to review strategic suppliers, recurring problems, contract performance, and sourcing decisions.
A supplier with a 98% annual on-time rate can still create a serious production problem if its two recent late shipments affected the same critical component.
For that reason, manufacturers should look at both current exceptions and longer-term trends.
Common Vendor Scorecard Mistakes Manufacturers Should Avoid
Below are some of the common mistakes that manufacturers make in vendor scorecards:
Using the same metrics for every supplier
A packaging supplier, machining supplier, electronics supplier, and contract manufacturer have very different performance requirements.
Measuring delivery without defining the date
If buyers, suppliers, and reports use different definitions of “on time,” the score becomes difficult to trust.
Looking only at the vendor level
Supplier averages can hide item-specific quality and delivery problems.
Counting defects without considering volume
Ten defects from 100 units and ten defects from 100,000 units do not represent the same quality performance.
Creating a score without an action process
A dashboard that shows a red metric but gives procurement no path to investigate the cause becomes another reporting exercise.
Treating native NetSuite functionality as a complete supplier scorecard
NetSuite’s native Vendor Delivery Performance functionality provides a useful delivery foundation, but manufacturers may need custom KPIs, saved searches, and Quality Management processes to measure the broader supplier-performance picture.
A Practical Manufacturing Vendor Scorecard
A manufacturer can use the following structure as a starting point:
| Performance Area | KPI | What to Investigate When It Declines |
|---|---|---|
| Delivery | OTIF % | Late POs, partial receipts, supplier capacity |
| Delivery | On-time delivery % | Expected vs. actual receipt dates |
| Quality | Defect rate / PPM | Failed inspections, defect types, affected lots |
| Quality | NCR trend | Recurring supplier issues |
| Quality | CAPA closure | Overdue corrective actions |
| Lead time | Average days early/late | Supplier planning reliability |
| Lead time | Lead-time variability | Unpredictable replenishment |
| Cost | PPV | Price changes, PO/bill differences |
| Responsiveness | Response/closure time | Supplier communication and corrective actions |
The scorecard does not need to turn every metric into one composite number.
For many manufacturers, a dashboard showing the right KPIs with clear drill-downs is more useful than a single supplier score that hides how the number was calculated.
How Manufacturers Should Act on Vendor Performance Data
A vendor scorecard should help procurement, quality, planning, and manufacturing teams answer the same question from different angles:
Which suppliers are creating risk for production, and what specifically is causing it?
NetSuite provides a useful foundation through Vendor Delivery Performance, its Procurement Dashboard scorecard, vendor performance predictions, saved searches, and, where implemented, Quality Management processes.
Manufacturers can build on that foundation with metrics for OTIF, supplier quality, lead-time variability, purchase price variance, responsiveness, NCRs, and corrective actions.
The strongest scorecard then goes one level deeper. It connects the supplier to the affected item, purchase order, receipt, lot, inspection, and corrective action.
That turns vendor performance data into something procurement and operations teams can use: a way to identify recurring supply problems early, understand their production impact, and take action before the same issue affects the next work order or customer commitment.
FAQs
Does NetSuite have vendor performance tracking?
Yes. NetSuite includes native Vendor Delivery Performance functionality and a Vendor Delivery Performance KPI Scorecard on the Procurement Dashboard. The scorecard includes total purchase orders, late or unreceived orders by vendor, and on-time delivery performance. NetSuite can also calculate predicted days early or late and predicted risk confidence from historical vendor performance.
Can NetSuite track supplier quality?
Yes, when the appropriate Quality Management processes are configured. NetSuite Quality Management supports inspections, quality specifications, non-conformance records, and corrective and preventive actions. These records can provide the underlying data for supplier-quality reporting.
Can manufacturers customize the vendor scorecard in NetSuite?
Yes. NetSuite supports custom KPIs based on saved searches on the Procurement Dashboard. Manufacturers can use these capabilities to extend native vendor-delivery measurements with additional purchasing or operational KPIs.
Should manufacturers use one overall supplier score?
A single score can be useful for high-level prioritization, but it should not replace the individual metrics behind it. Manufacturers should be able to drill into delivery, quality, lead time, cost, and responsiveness and identify the specific item or transaction causing the change.
What is the most important supplier KPI for manufacturers?
There is no universal KPI. For a production-critical supplier, OTIF and lead-time reliability may be central. For a quality-sensitive or regulated manufacturer, inspection failures, NCRs, and corrective-action performance may carry more weight. The right KPIs are the ones that reflect the supplier risks that can affect production, quality, cost, or customer commitments.
