Considered one of the most essential parts of the Oracle NetSuite ERP platform, dashboards allow users to get to the information they use and need most quickly. When set up correctly, these dashboards can be customized for each organizational member or team so they can work effectively and stay motivated, thanks to their easy-to-view metrics and objectives.
This guide will break down the different parts of the dashboard and how they can be used and published for best practices within your organization.
What is a NetSuite Dashboard?
While many may think the horizontal bar at the top of their screen is the dashboard, this is the NetSuite center. Your NetSuite dashboard is the home screen itself, and it contains a full view of the metrics you and your teams have created within the ERP platform. It offers a snapshot of trends, reports you’re working on and their status, and a general overview of your function within the organization.

NetSuite dashboards can also be customized to display the details, metrics, and KPIs relevant to your function. Hence, you stay on top of your performance, and management can continue monitoring different activities.
Nonetheless, the homepage or home dashboard (accessed using the house icon) is still the best place for a NetSuite user to start their day, particularly for those who use it for client accounts. It offers the most important information updated daily to see where you left off and your clients’ status. This single source of information is displayed in what we call “portlets.”
NetSuite Dashboard Examples
Key Performance Indicators (KPIs)
While NetSuite offers enough dashboard options in almost any industry, the KPIs are often the most important to management and business owners. Again, these can be viewed as a meter, which is a visual gauge of where you are concerning your objectives. They can also be depicted as graphs, which give a more comparative view using colors and bars to show differences.
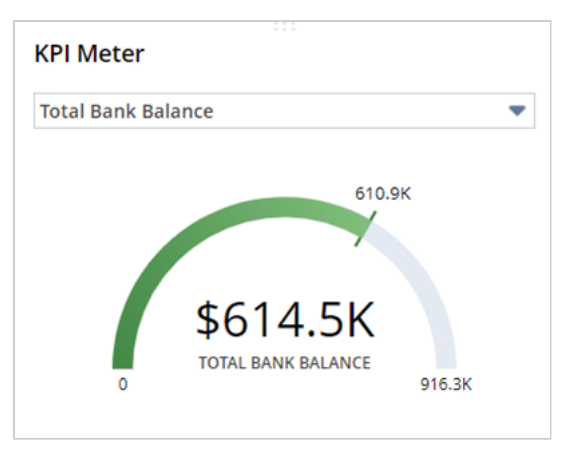
Key Performance Indicators (KPIs) are often used for more goal-oriented NetSuite dashboards and can be set up in the format of your choice, as we just saw. Those in a customer-facing role, such as customer experience or sales, can use these metrics to view their ongoing performance.
Report Snapshot
NetSuite provides convenient Report Snapshot portlets on your dashboard, giving you instant access to key business insights. These portlets offer high-level summaries of selected reports for a specific date or period. You can customize the formats with charts and lists.
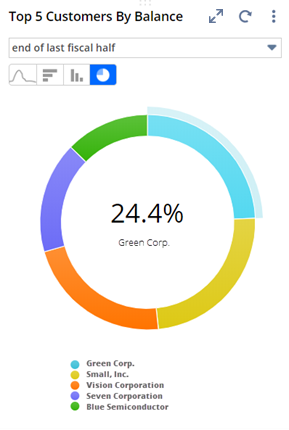
You can also configure the charts’ display, order, and theme and quickly expand them to full-screen. The portlets offer menu options for printing, downloading content in various formats, and viewing detailed data of the underlying report. Just hover over the chart data points for quick value displays, making accessing and interpreting essential business information easier.
Workbooks
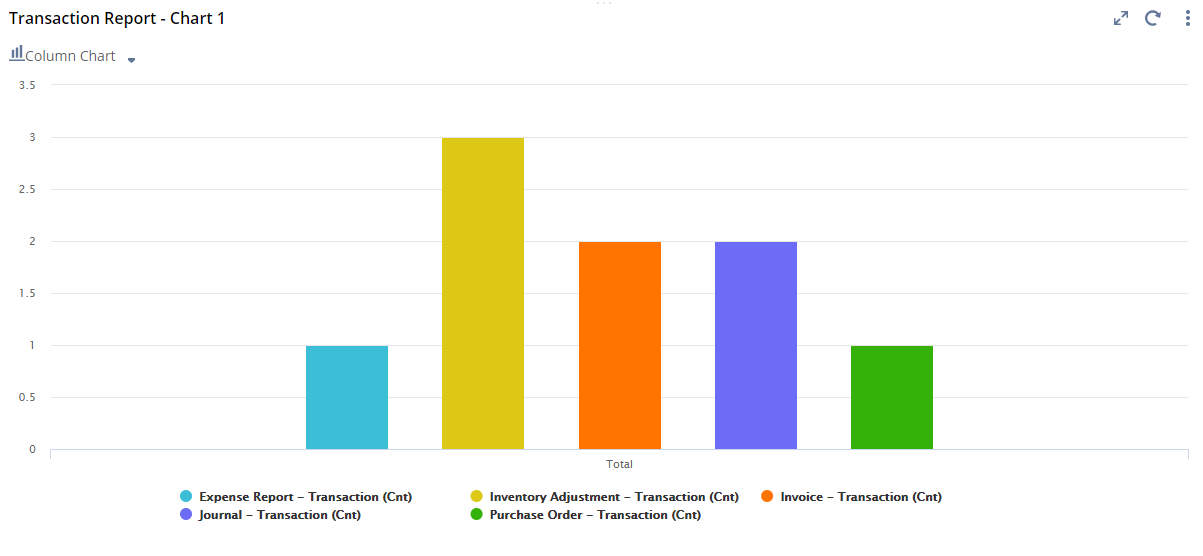
You can use the Analytics portlet in NetSuite to add up to 10 Analytics Portlets on your dashboard. Each portlet can display a single visualization from your workbook, whether a chart, pivot table, or table view.
Customize the layout options, such as the size and chart type for charts, or set the height for pivot tables and table views.
This feature allows you to access your saved workbooks and those shared by other users. Even if you don’t own them, as long as you have Analytics Administrator permission, you can view, edit, and delete the workbooks.
It’s a great way to enhance the functionality of your dashboard and get a quick overview of the most important visualizations.
Personalizing Your NetSuite Dashboard
To personalize your NetSuite dashboard as an end-user, follow these steps for a more tailored and effective experience:
- Begin by clicking on the “Personalize” option in your dashboard’s top right-hand corner.
- This action will open a drop-down menu, often called the personalized dashboard or portlet menu.
- Within this menu, you can easily customize your dashboard by dragging and dropping portlets to your screen.
By engaging in this process, you can modify the information overview, data, and reports displayed on your home dashboard. Taking the time to make these adjustments allows businesses and users to create a dashboard that aligns with their specific needs and preferences, ultimately contributing to a more successful and personalized user experience.
Getting the Most Out of Your NetSuite Dashboard
Want to optimize your NetSuite Dashboard experience? Here are three tips to get you started!
First, check out SuiteApp Bundles like Subsidiary Navigator, Dashboard Tiles, and Application and Performance Monitoring. They’re free enhancements that can take your dashboard to the next level. Install them and access them through the Custom Portlet.
Next, take advantage of In-Line Editing and the Create New menus in Lists and Saved Searches. This allows you to go beyond just viewing data. Edit information directly from the dashboard and effortlessly create child records.
Lastly, personalize and share dashboards with your team if you’re an administrator. This ensures consistency and helps users who may not be familiar with system configurations. Lock down and provision dashboards easily with our provided instructions.
Implementing these best practices will enhance efficiency and empower your team to make the most of the NetSuite Dashboard. Let’s take your dashboard experience to new heights!
NetSuite Reporting & Dashboards Benefits
Data at Your Fingertips: With NetSuite, you have data at your fingertips. Personalize your information easily and access it whenever you need. Get valuable insights from custom dashboards that give you role-relevant data, key performance indicators (KPIs), and visually appealing charts and graphs. Stay informed, make data-driven decisions, and confidently drive your business forward.
Improved Visibility: When you have real-time visibility into performance across all business areas, it becomes easier for decision-makers to communicate effectively. This enhanced visibility allows you to closely monitor and analyze key metrics, enabling you to make more informed decisions and plan strategically.
Less Reliance on IT: Embedded analytics provides a game-changing advantage by reducing the reliance on IT. With this technology, users can quickly address their queries without needing IT staff’s assistance. This increased autonomy not only saves time but also empowers individuals to make data-driven decisions easily.
Role-Based Security: NetSuite offers a strong security framework with granular permissions. This means that your teams will only have access to relevant information about their roles. With this level of control, you can confidently manage and protect sensitive data, reducing the risk of unauthorized access and ensuring compliance with regulatory requirements.
Conclusion
The NetSuite Dashboard is a crucial tool within the Oracle NetSuite ERP platform. It’s like a centralized and customizable hub where users can access key metrics and insights. Organizations can make better decisions and boost efficiency by using cool features like KPIs, Report Snapshots, and Workbooks.
And the best part? You can personalize the dashboard to fit your needs and preferences. With helpful tips for optimization and the added benefits of improved visibility and less reliance on IT, NetSuite empowers businesses to stay agile, make data-driven decisions, and foster growth in today’s dynamic business landscape.